In August 2023, the Next Generation Dx conference in Washington had a number of exceptionally worthwhile talks. Two of them will be highlighted here at Discoveries in Health Policy. A future blog will discuss the presentation of Lee Fliescher MD, prior chief medical officer at CMS, who provided insights into TCET, CED, and other CMS topics.
Today, I'd like to highlight one of several excellent talks on pharmacogenomics. This talk, by Annette Taylor MS, PhD of Labcorp, featured research by the STRIPE Collaborative Community’s Study Design Task Force [1], to appear soon as Patel JN et al. Her talk reviewed several major recent papers in PGx, the landmark MolDX PGx policy in 2020 for which she played an advisory role, and similar Medicare policies at Novitas/FCSO, and she reviewed selected early data from Patel.
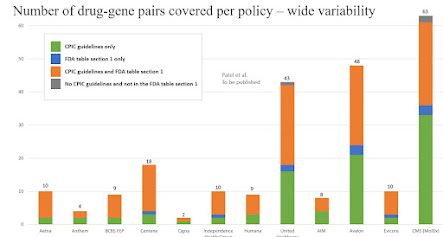
Patel et al. evaluated 12 payor or LBM policies for their PGx coverage. As shown in the bar chart below, coverage for the 63 strong evidence drug-gene pairs assessed ranged from 2 (Cigna) to 63 (MolDX), suggesting wide disparities currently in the coverage process (Patel et al., submitted 2023). See a select bar chart below from their data. I'll cover the range of research findings in more detail when the paper appears.
Connections
- AMA just published a white paper study of the diverse range of coverage for the AMA CPT digital medicine codes. My blog here.
- Translational Genomics, a major supplier of PGx software, just shut down after difficult interactions with FDA. My blog here.
 |
| Click to Enlarge |
###
AI Corner
I asked ChatGPT4 to read and discuss a JPEG of the figure above. This is the verbatim AI result.
CHAT:
This graphic represents the number of drug-gene pairs covered per policy, with an emphasis on the wide variability across different entities. The entities appear to be health insurance or healthcare-related organizations. The vertical bars represent the number of drug-gene pairs covered by each entity's policy. The color segments of each bar correspond to different criteria for the drug-gene pair inclusion:
Green: Drug-gene pairs covered under "CPIC guidelines only."
Orange: Drug-gene pairs that fall under "FDA table section 1 only."
Blue: Drug-gene pairs that are covered by both "CPIC guidelines and FDA table section 1."
Grey: Drug-gene pairs that have "No CPIC guidelines and are not in the FDA table section 1."
For example, the entity "Aetna" has 10 drug-gene pairs covered under the "FDA table section 1 only" category. Meanwhile, "CMS (MolDx)" covers the most drug-gene pairs overall, with a total of 63, distributed among the different categories. The bar for "Patel et al. To be published" seems to have a special note, possibly indicating a future publication that will cover 43 drug-gene pairs.
The primary takeaway from this graphic is the variability in drug-gene pair coverage policies among different entities and the criteria they use for inclusion.
