On October 12, 2023, CMS released Part B payment files for CY2022, in two sets.
- One is "national" by code series (e.g. lab, radiology, etc).
- The other set is "carrier" which is basically by state... but not quite.
- Each geographic Excel is a MAC contract subdistrict, usually a state.
- It's hard to find up to date tables that map a state to a CMS contract code number, so with these files, you're guessing which state is file #01112, which state is #03302, etc.
https://www.cms.gov/data-research/statistics-trends-and-reports/part-b-national-summary-data-file
Although a little clumsy to use (because they are either split up by small code series or else by state), the new data demonstrates that CMS finally stopped its $300M a year of "bleeding" due to 81408 fraud. Separate blog - here.
UPDATE: There's also a cloud database that (after a learning curve) would usually be a better resource than the Xcel files, and it's also already updated for CY2022 claims data. Thanks to John Leppard at Washington Analysis for a heads-up to this public link at CMS:
https://data.cms.gov/summary-statistics-on-use-and-payments/physiciansupplier-procedure-summary
The above is not the most complete database; on a longer delay, CMS released a database with every CPT code for every lab and doctor - but that's about 18 months after the end of a calendar year - here.
All Lab Codes
For 80,000 series codes, plus --U and --M codes, I sorted for only rows with the modifier "total."
This gives 1668 rows of lab services, and allowed charges (including path codes and COVID codes) of $8.4B, roughly in line with recent years. (2021 had been about $9B with about $1B in COVID and $0.5B in fraud.)
2022 COVID was $500M for U0003 and $155M for U0004 and $196M for U0005; spreadsheet MISC. They bring the Lab total to about $8.4B, otherwise $7.5B.
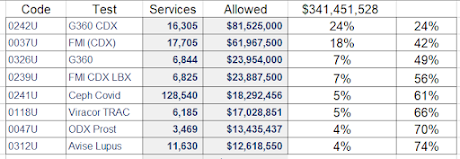
PLA: U and M Codes
U and M codes run up to 0354U, totalling 136 lines (the spreadsheet has no entry for codes with 0 CMS payment, more than half of them in this set.)
Total spending for these codes was $341M allowable, but it was highly concentrated, with 75% of spending for 136 lines, concentrated in the top 8 lines.
FDA Tests Score Big Dollars: While I suspect very few of all PLA tests are FDA approved, FDA approved PLA tests garnered 4 of the 5 top tests, and the top 5 tests had 60% of all the money.
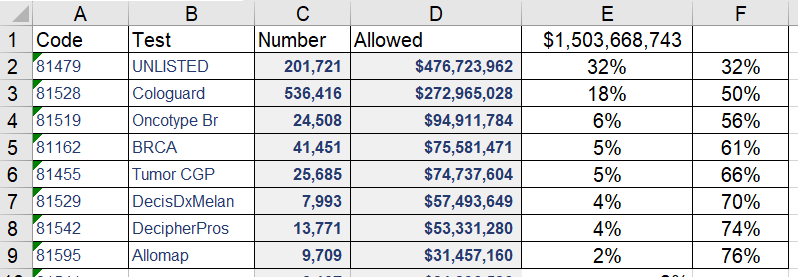
Tier 1 CPT Genomic Codes
In the Tier 1 "Genomic" CPT codes - 811, 812, 813, 814, 815xx - spending was $1.5B, shown in 275 lines.
Again, 75% of the spending was in the top 8 codes.
81479
One-third of all spending was 81479, unlisted code, racking up $476M. 81479 is also highly concentrated with 975 of spending in 10 codes (90% in 5 codes). 93% of 81479 spending is in MolDx states, 7% in Novitas states. See more about 81479 below.
After 81479, Cologuard trailed at $273M, and then dollars plummeted again to just $95M for Oncotype and $75M for BRCA.
Leaving aside Unlisted Code, 5 of the top 7 genomic codes were MAAA codes.
Compare to my October 2022 report on 2021 spending here.